

The Mathematics Behind the Heartbeat: How ECGs Display Cardiac Electrical Activity
Many healthcare students learn to recognize ECG rhythms by memorizing patterns. While pattern recognition is important, understanding why those patterns appear on the monitor provides a much deeper appreciation of cardiac physiology.
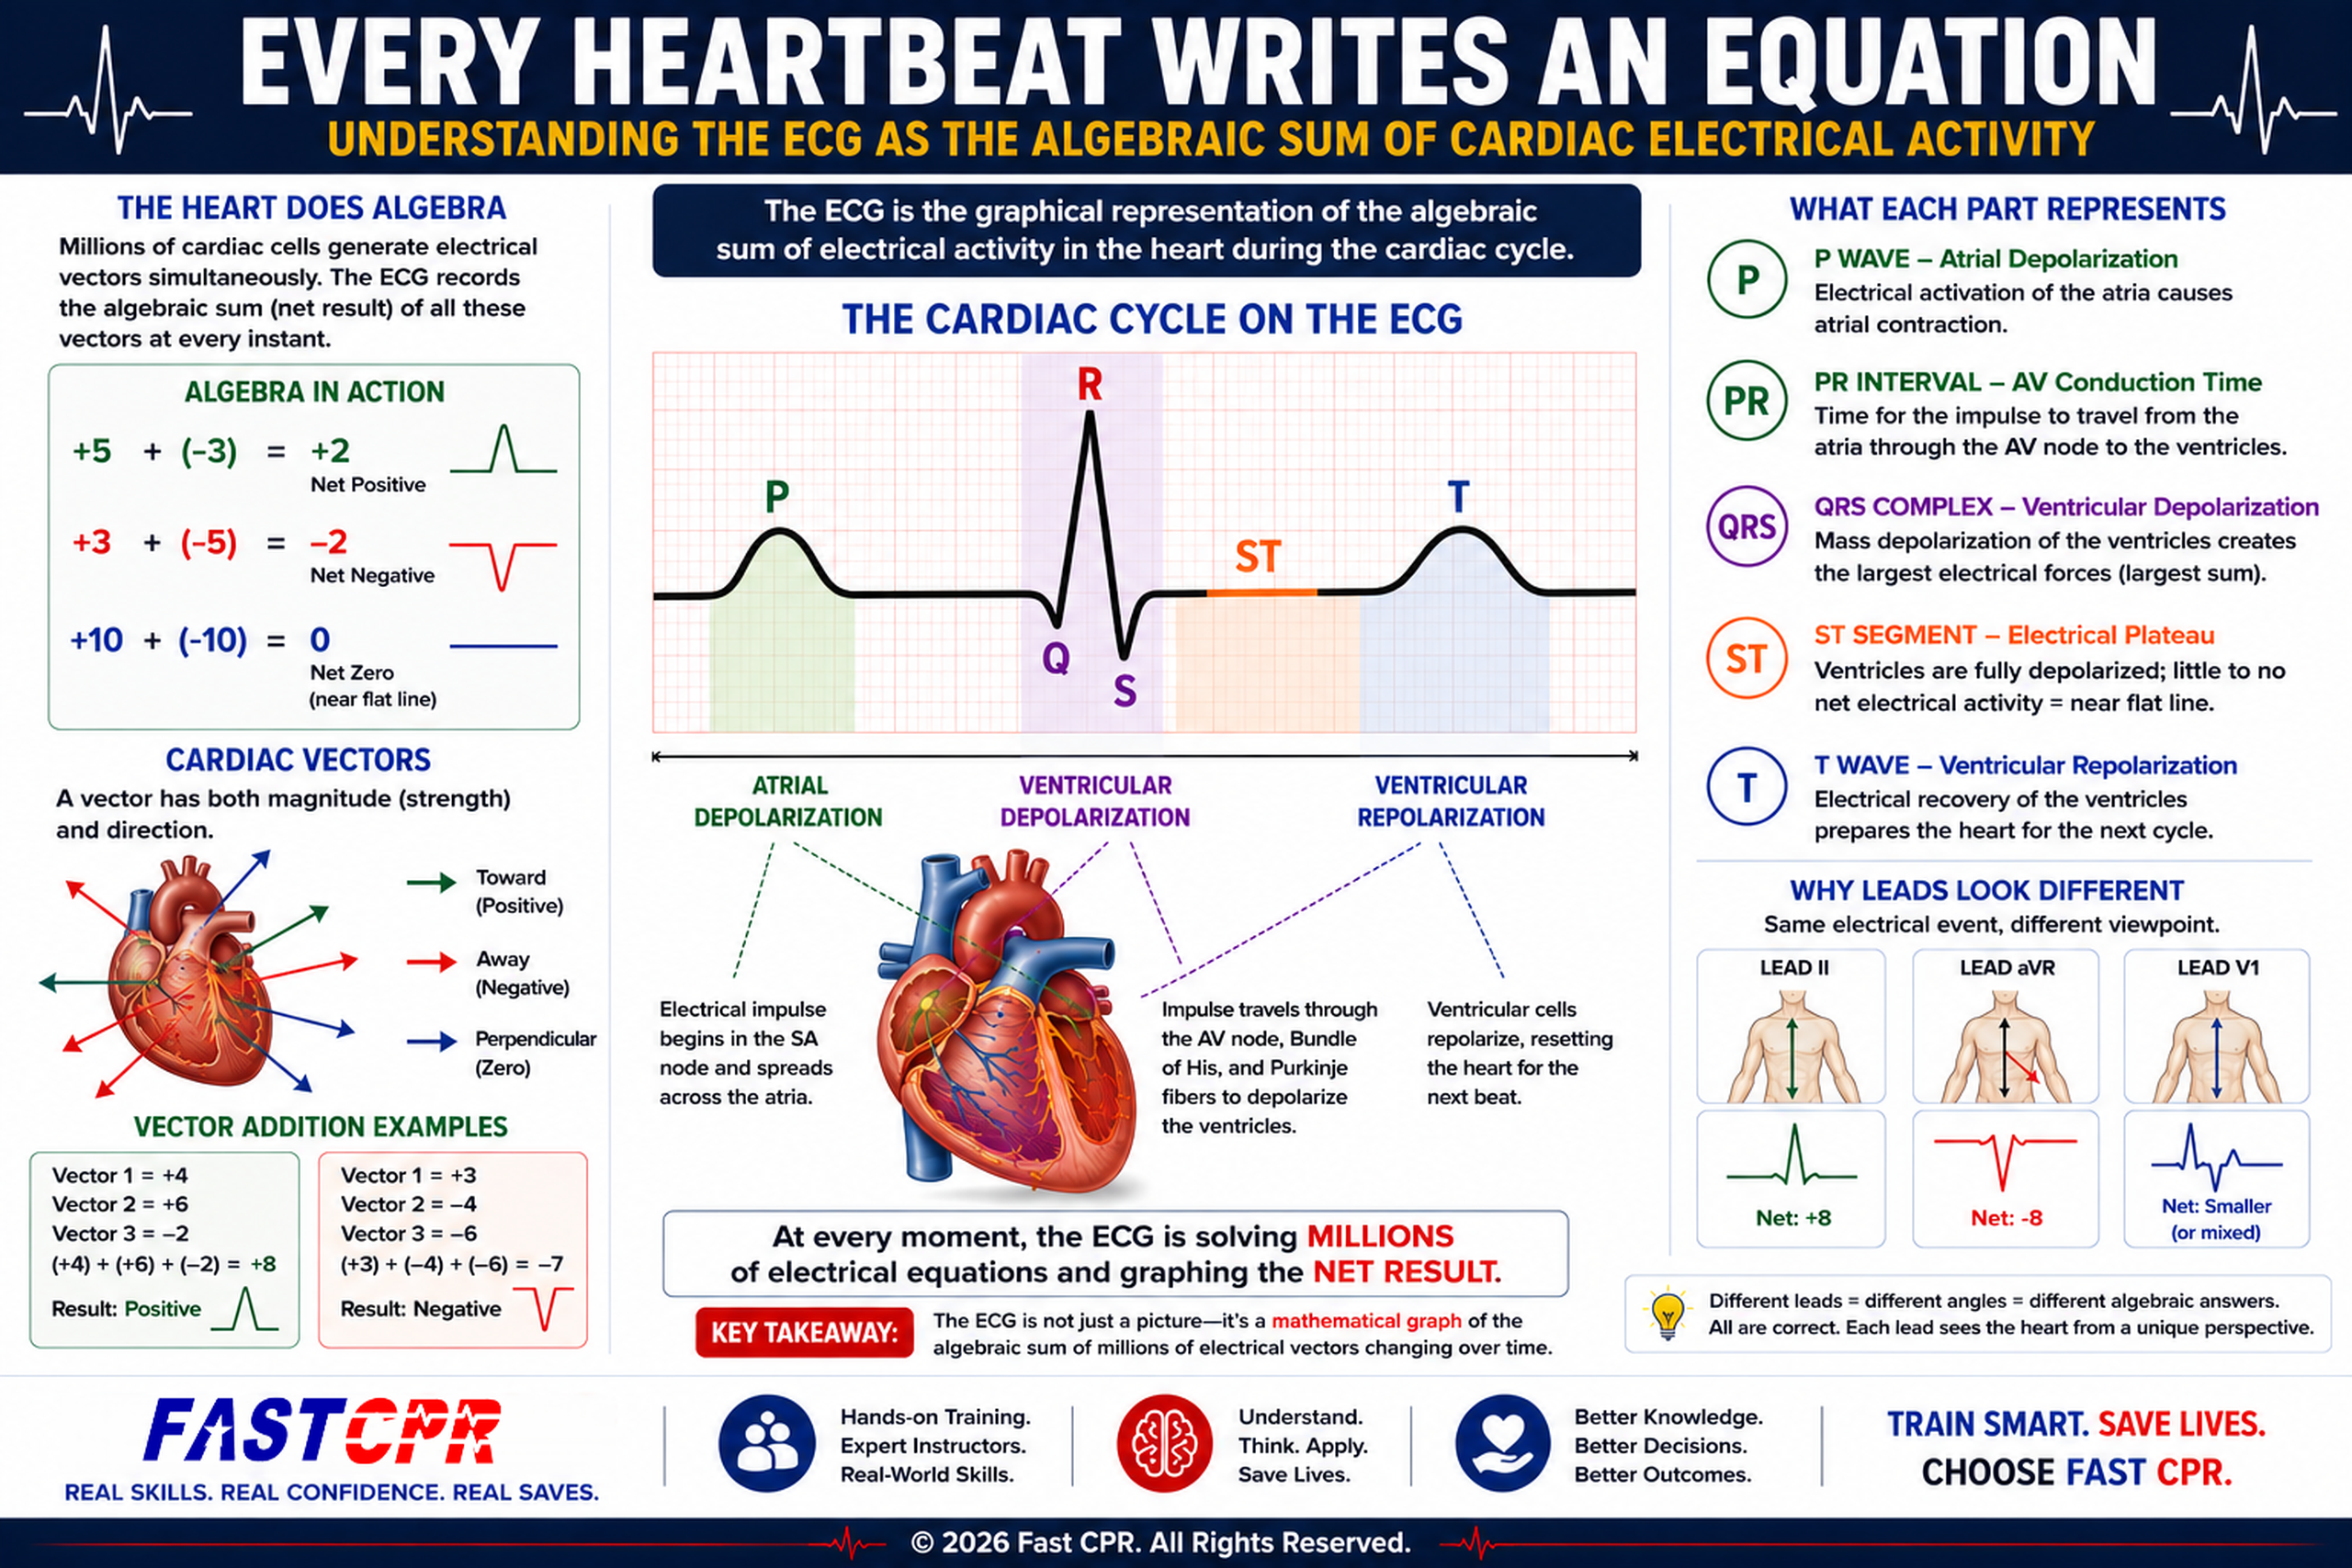
At its core, an electrocardiogram (ECG) is the graphical representation of the algebraic sum of electrical activity occurring throughout the heart during the cardiac cycle.
That sounds complicated, but let’s break it down.
The Heart: A Giant Electrical System
The heart is not simply a pump. It is an electrically controlled pump.
Every heartbeat begins when specialized cells generate an electrical impulse. That impulse travels through the heart muscle, causing millions of cardiac muscle cells to depolarize and contract in a coordinated sequence.
As these cells generate and conduct electricity, tiny electrical currents spread throughout the heart and surrounding tissues. ECG electrodes placed on the skin detect these currents.
The ECG machine does not directly see heart muscle contraction. Instead, it records the electrical activity that precedes contraction.
The Heart Does Algebra Whether We Like It or Not
Many people hear the word “algebra” and immediately think of high school math classes.
Ironically, your heart has been doing algebra your entire life.
Every cardiac cell generates tiny electrical currents. At any given moment, millions of these cells are either depolarizing, repolarizing, or resting. The ECG machine does not display each individual electrical event. Instead, it records the algebraic sum of all electrical activity occurring at that instant.
Think of every cardiac cell as contributing a small positive or negative number to a giant equation.
If one group of cells contributes +5 units of electrical force while another contributes -3 units, the ECG sees:
+5 + (-3) = +2
The tracing moves upward because the net electrical force remains positive.
If the situation reverses:
+3 + (-5) = -2
The tracing moves downward because the net electrical force is negative.
The ECG is constantly solving these equations hundreds of times per second.
What Does “Algebraic Sum” Mean?
Imagine thousands of people pushing shopping carts in different directions across a parking lot.
Some are moving north.
Some are moving south.
Some are moving east.
Some are moving west.
If we wanted to know the overall movement of the crowd, we would not simply count the number of carts. We would calculate the combined direction and strength of all movements occurring at the same time.
The heart behaves similarly.
Millions of cardiac cells generate electrical vectors simultaneously. Each vector has:
- Direction
- Magnitude (strength)
The ECG machine measures the algebraic sum of all these vectors.
Some electrical forces reinforce each other.
Some electrical forces cancel each other out.
The resulting waveform represents the net electrical activity occurring at that moment.
Understanding Cardiac Vectors
A vector is an electrical force that has both magnitude and direction.
As depolarization spreads through the myocardium, electrical vectors are continuously generated.
When electrical activity moves toward a positive electrode, the ECG tracing generally moves upward.
When electrical activity moves away from a positive electrode, the ECG tracing generally moves downward.
When electrical forces move perpendicular to the electrode, little or no deflection occurs.
This is why different ECG leads view the same heartbeat differently. Each lead observes the electrical activity from a unique angle.
Think of it as several cameras recording the same sporting event from different locations.
Why Flat Lines Are Not Always “No Activity”
One of the biggest misconceptions among beginners is that a flat line means nothing is happening electrically.
In algebra, if:
+10 + (-10) = 0
the result is zero.
That does not mean nothing existed.
It means the positive and negative values balanced each other perfectly.
The same thing occurs in the heart.
During certain portions of the cardiac cycle, electrical forces may cancel each other out. The ECG pen remains near baseline even though millions of cardiac cells are actively generating electrical activity.
The machine records the net result.
Not the individual components.
The P Wave
The P wave represents atrial depolarization.
As electrical activity spreads through the right and left atria, the combined electrical vectors produce a small positive deflection in many ECG leads.
The P wave does not represent atrial contraction itself.
Rather, it represents the electrical event that causes atrial contraction.
Electrical activity always comes first.
Mechanical activity follows.
The PR Interval
The PR interval reflects the time required for the electrical impulse to travel from the atria through the atrioventricular (AV) node and into the ventricles.
The AV node acts as a traffic controller.
This brief delay allows the ventricles to fill with blood before ventricular contraction begins.
Without this delay, cardiac efficiency would be greatly reduced.
The QRS Complex: An Algebra Problem with Millions of Variables
The QRS complex is often viewed simply as ventricular depolarization.
A more mathematical perspective is that the QRS complex represents the algebraic solution to millions of simultaneously changing electrical vectors.
As depolarization sweeps through the ventricles:
- Some vectors point toward a lead.
- Some point away from a lead.
- Some are stronger.
- Some are weaker.
At every instant, the ECG calculates:
Vector A + Vector B + Vector C + Vector D + …
The resulting sum determines the height and direction of the waveform.
The large upward R wave appears because the majority of ventricular depolarization vectors are directed toward the observing lead, creating a large positive sum.
Because the ventricles contain much more muscle mass than the atria, the electrical forces generated are significantly larger.
This is why the QRS complex is usually much taller and wider than the P wave.
Why Different Leads See Different Answers
Imagine five students solving the same algebra problem from different viewpoints.
Each student might focus on different parts of the equation.
ECG leads work similarly.
The heart generates one electrical event, but each lead observes that event from a different angle.
Lead II may see:
+8
while Lead aVR may see:
-8
Both are correct.
Neither lead is wrong.
They are simply measuring the same electrical activity from different perspectives.
This explains why the same heartbeat can produce dramatically different waveforms across the twelve ECG leads.
Vector Addition: The Hidden Language of ECGs
Every ECG waveform is ultimately a vector addition problem.
Suppose three groups of cells are generating electrical forces:
Vector 1 = +4
Vector 2 = +6
Vector 3 = -2
The algebraic sum becomes:
(+4) + (+6) + (-2) = +8
The ECG records a positive deflection.
Now suppose another moment later:
(+3) + (-4) + (-6) = -7
The ECG records a negative deflection.
Although the actual mathematics inside the heart is far more complex, the principle remains the same.
The ECG is continuously displaying the algebraic outcome of countless electrical forces acting simultaneously.
The ST Segment
The ST segment occurs after ventricular depolarization is complete.
At this point, most ventricular cells are electrically similar.
Since there is little difference in electrical charge between neighboring cells, there is little net electrical movement.
As a result, the tracing typically appears relatively flat.
Changes in the ST segment may indicate myocardial ischemia, injury, or infarction.
The T Wave
The T wave represents ventricular repolarization.
Repolarization is the process by which cardiac cells reset their electrical charge in preparation for the next heartbeat.
Although repolarization is electrically opposite to depolarization, the T wave is often upright in many leads because of the unique sequence in which ventricular cells recover.
The ECG records the algebraic sum of these repolarization vectors, producing the familiar T-wave appearance.
Why ECG Interpretation Is Really Applied Algebra
Many healthcare students never realize they are using algebra when reading ECGs.
When interpreting an ECG, you are essentially asking:
- Is the net electrical force positive or negative?
- How large is the net sum?
- Which direction is the vector pointing?
- How quickly is the sum changing?
Every upward deflection, downward deflection, and flat segment represents the solution to an electrical algebra problem occurring inside the myocardium.
The ECG is not merely a picture of the heart.
It is a mathematical graph showing how the algebraic sum of electrical activity changes over time throughout the cardiac cycle.
Why the ECG Is So Valuable
The ECG provides a non-invasive window into the electrical behavior of the heart.
By analyzing waveforms, intervals, segments, and rhythm patterns, healthcare providers can identify:
- Arrhythmias
- Conduction abnormalities
- Myocardial ischemia
- Myocardial infarction
- Electrolyte disturbances
- Drug effects
- Cardiac chamber enlargement
All of this information comes from interpreting the graphical representation of electrical activity occurring within the heart.
Looking Beyond Memorization
Students often focus on memorizing rhythm strips.
While rhythm recognition is important, understanding the underlying electrical principles transforms ECG interpretation from memorization into reasoning.
When you understand that every wave, interval, and segment represents the algebraic sum of millions of electrical vectors generated during the cardiac cycle, the ECG becomes much more than a collection of lines on paper.
It becomes a real-time map of the heart’s electrical behavior.
Final Thoughts
The next time you look at an ECG, remember that you are not simply viewing lines and squiggles on a screen. You are observing the graphical representation of countless electrical events occurring inside the heart.
Every P wave tells the story of atrial depolarization.
Every QRS complex reflects the powerful electrical activation of the ventricles.
Every T wave represents the heart preparing itself for the next beat.
From a mathematical perspective, every deflection on the ECG is the result of an ongoing algebra problem. Millions of cardiac cells generate electrical vectors, some positive and some negative, some reinforcing each other and some canceling each other out. The ECG continuously displays the algebraic sum of these electrical forces as they change throughout the cardiac cycle.
An ECG is more than a rhythm strip. It is a continuously updated graph of the algebraic sum of millions of electrical events occurring within the myocardium. Every heartbeat writes a new equation, and the ECG allows us to see the answer.
At Fast CPR, we believe that great healthcare education goes beyond memorization. Anyone can memorize a rhythm chart or learn a list of ECG findings. Our goal is to help students understand the “why” behind what they are seeing. Whether you are learning CPR, BLS, ACLS, ECG interpretation, or advanced cardiac concepts, understanding the underlying physiology, physics, and even algebra of the heart helps transform information into practical knowledge.
When students understand how electrical vectors combine to create the waveforms they see on the monitor, ECG interpretation becomes less about guessing and more about reasoning. This deeper understanding builds confidence, improves clinical decision-making, and helps healthcare providers respond effectively when real patients need them most.
At Fast CPR, we take a no-nonsense approach to healthcare education. We emphasize participation, teamwork, critical thinking, and real-world application so students leave with knowledge they can actually use.
